Dashboard Sections
The Dashboard provides an overview of vStor performance in dedicated panes.
Pools
There are separate panes for each pool, presenting the following information:
- pool name and status
- storage allocation
- compression and deduplication ratio
- storage usage history or storage usage trend.
The user can select to display data for the past day, week or month.

Mounted File Systems
This section displays snapshots mounted for granular file restore and the following information:
- mounted snapshot name
- pool of origin
- parent volume name
- GuardMode scan status
- time to expiry

This section is not automatically refreshed. To refresh manually, use the Refresh button.
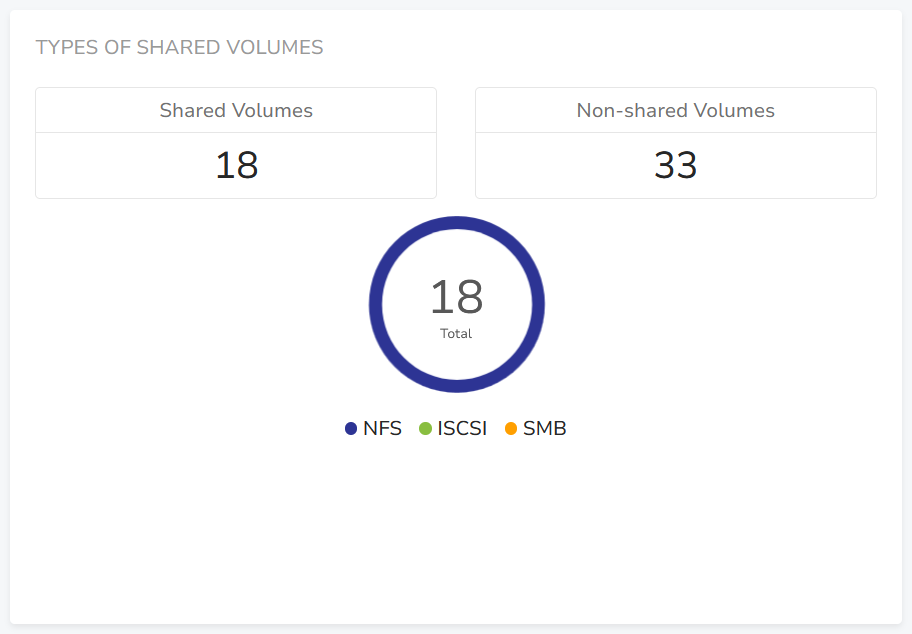
Types of Shared Volumes
This section shows the total number of shared and non-shared volumes on vStor.
Disks
This section lists all disks and their details.

This section is not automatically refreshed. To update data manually, use the Rescan button.
Replication & Offload Sessions Overview
This section displays a brief summary of replication and offload sessions within the last day, week or month.

Replication & Offload History
This section shows the replication and offload history over time, within the last day, week or month.
